Urban Scanner Project

Urban Scanner project

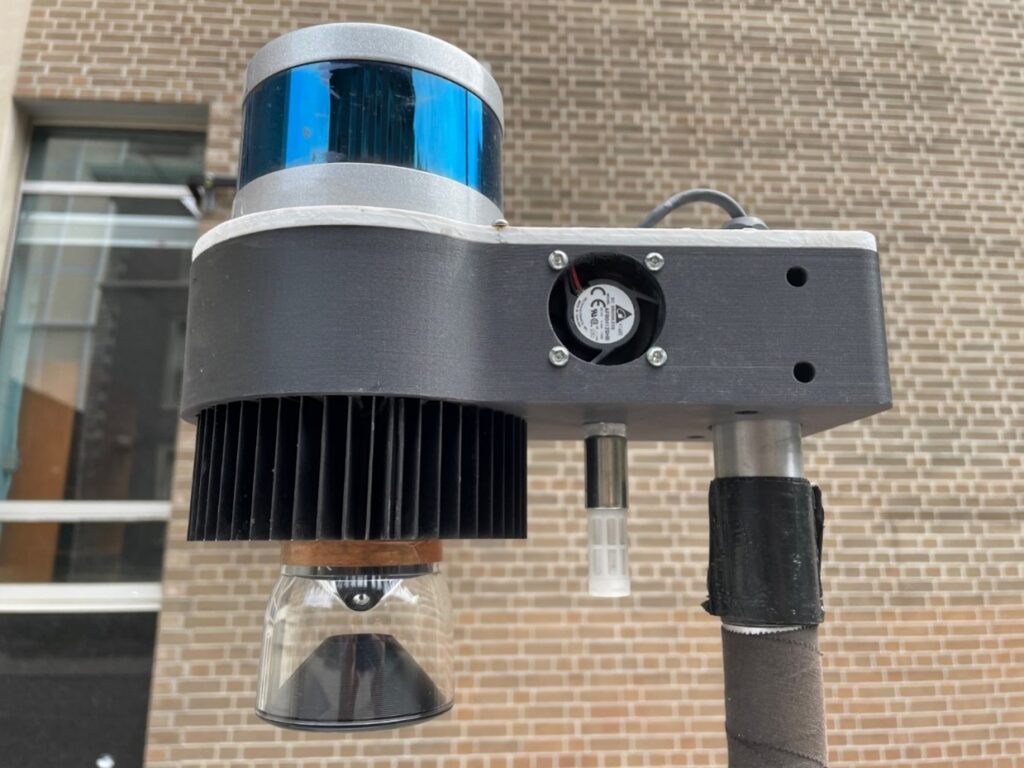
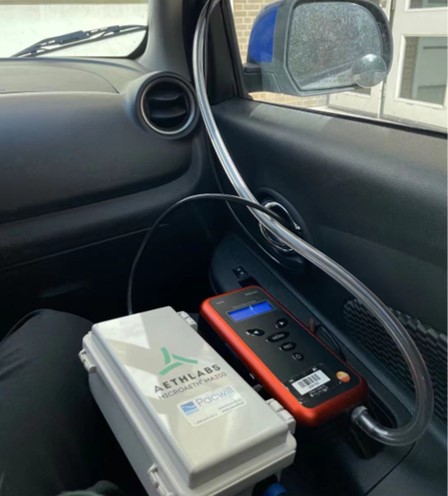
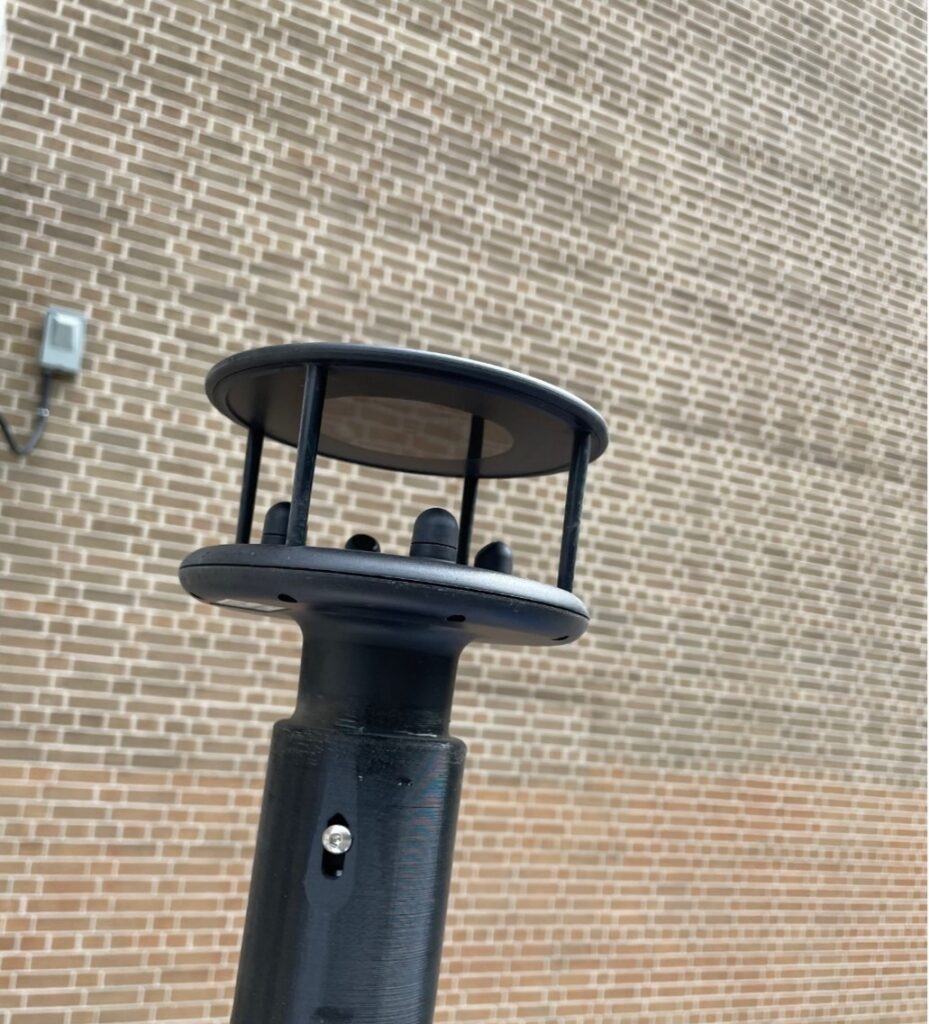
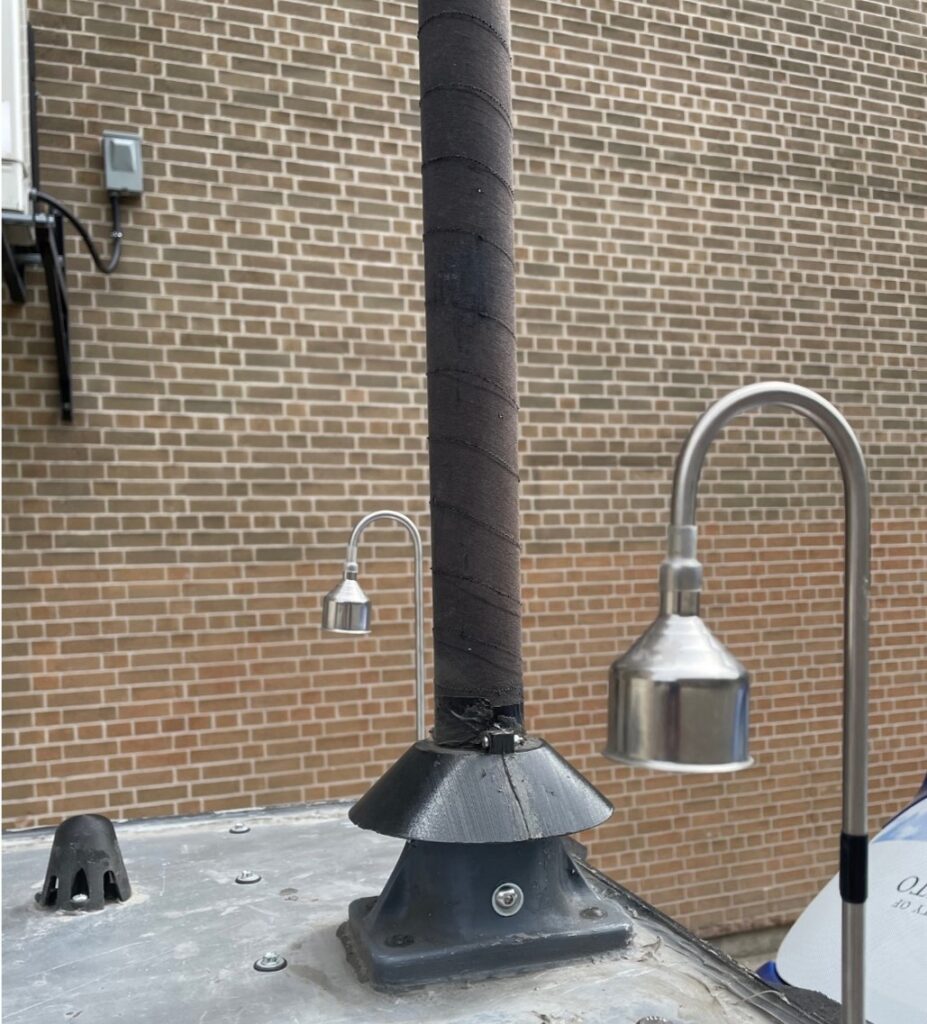
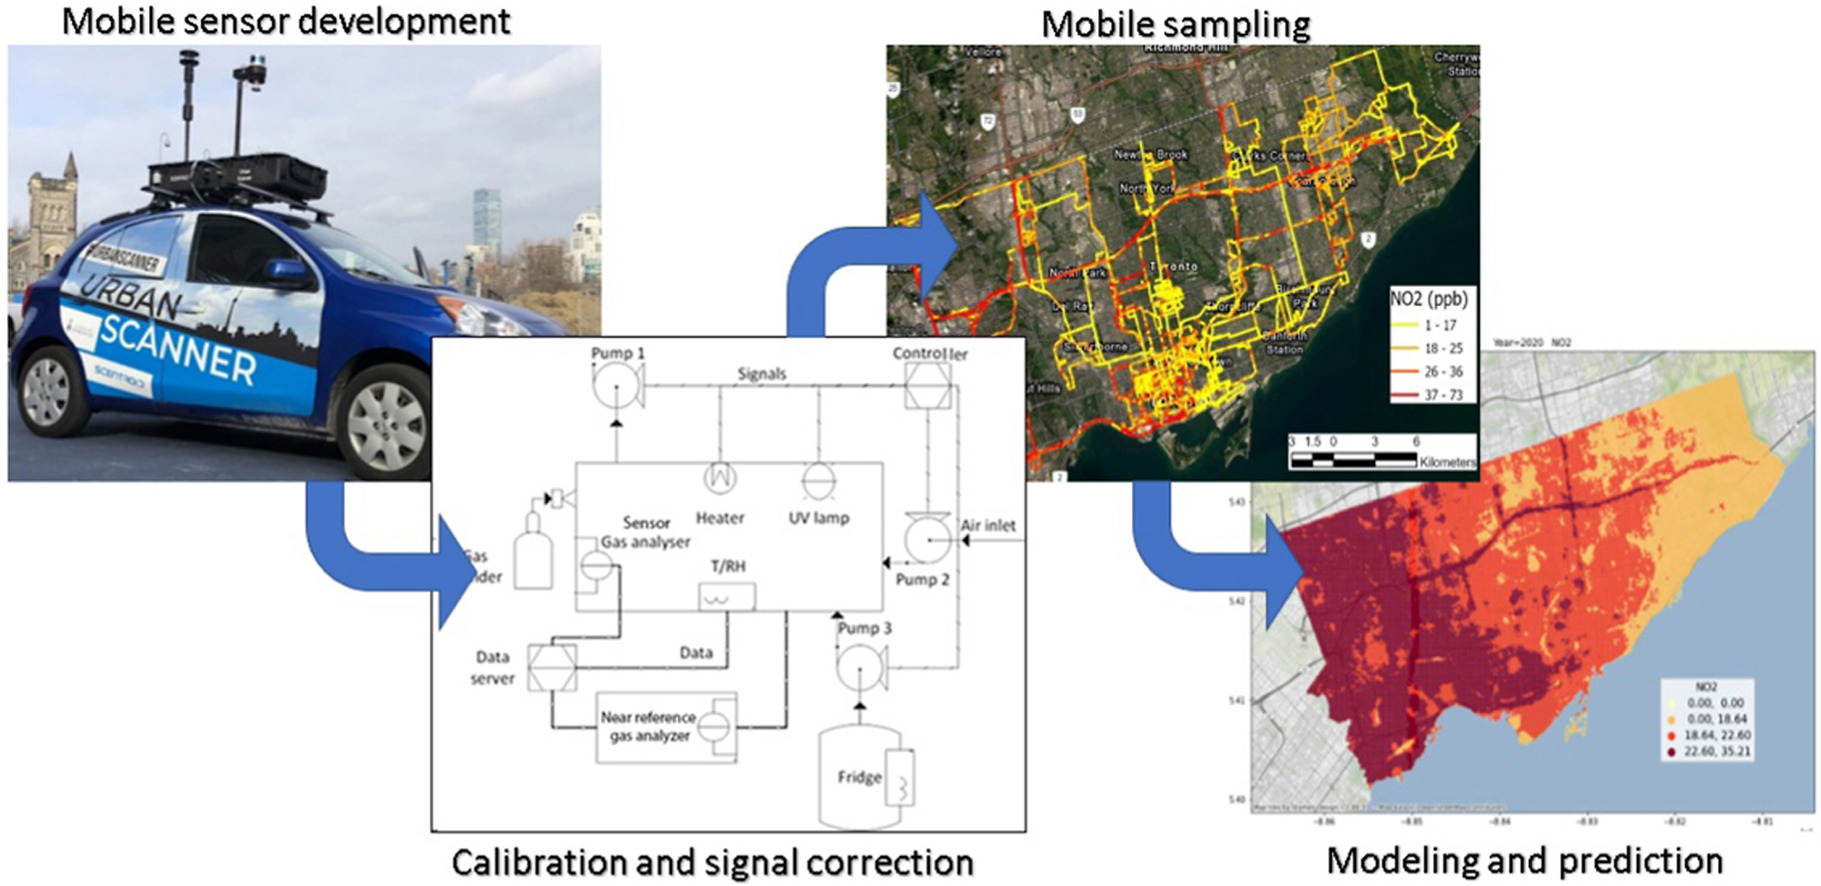
Urban Scanner is an integrated platform that provides high-resolution spatiotemporal air quality information within urban environments. It collects and combines a variety of information such as air pollution concentration, a 3D map of the city, traffic conditions, micro-weather patterns, etc.

Picture1

Urban Scanner mobile measurement platform

Lidar & 360-degree camera

Aethalometer & DiSCmini (measuring black carbon & ultrafine particles (UFPs))

Wind probe

Airflow inlets (measuring particulate matter (PM), NO2, O3, CO, etc.)

Research study #1:
Design, calibration, and testing of a mobile sensor system for air pollution and built environment data collection: The urban scanner platform

  1. This study describes a mobile air pollution sampling system, the Urban Scanner, which aims at gathering dense spatiotemporal air quality data to support urban air quality and exposure science.

  2. Urban Scanner comprises custom vehicle-mounted sensors for air pollution, meteorology, and built environment data collection (low-cost sensors, wind anemometer, 360 deg camera, LIDAR, GPS) as well as a server to store, process, and map all gathered geo-referenced sensory information.

  3. Two levels of sensor calibration were implemented, both in a chamber and in the field, against reference instrumentation. Algorithms were developed to remove noise and hysteresis from signals.

  4. We observe that the platform adequately captures spatial and temporal variability in urban air pollution, leading to the development of land-use regression models with high explanatory power.

Methodology

A methodology framework , including mobile sensor development, calibration and signal correction, mobile sampling, and modeling and prediction.

Key findings

1. Hysteresis removal for NO2 and O3 sensors. The sensor output varies with relative humidity and temperature in a nonlinear shape. The sensor signals are different at the same pollution level on the increasing and decreasing relative humidity and temperate curves.

Point plots of hysteresis removal for NO2 and O3 sensors

2. Artificial Neural Network (ANN) training and calibration results for O3. The input values for the calibration were Urban Scanner signals, temperature, and relative humidity.

Point polots of artificial Neural Network (ANN) training and calibration results for O3

3. Mean average NO2 (a) and O3 (b) concentrations over the road segments. The values represent the average concentration over each road segment.

Spatial distribution maps of mean average NO2 and O3 concentrations

4. Diurnal evolution of NO2 and O3 concentrations based on Urban Scanner measurements (a and c) and compared with the diurnal evolution captured at a near-road reference station in Toronto.

Boxplots of diurnal evolution of NO2 and O3 concentrations