Decarbonizing the UofT commute: How can we enable more sustainable and equitable mobility choices across the three campuses?
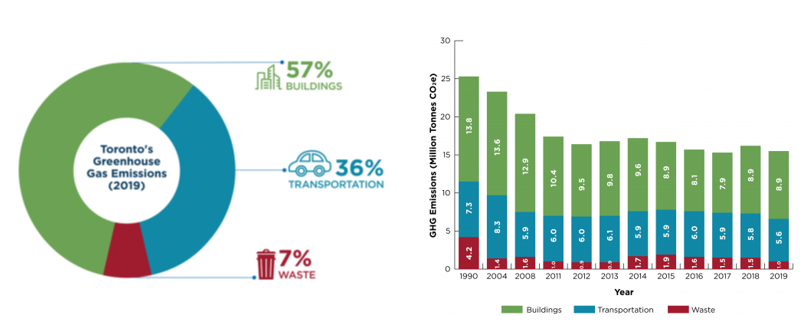
The pace of GHG reduction from transportation is slow: evidence from City of Toronto emission inventory
Ref: TransformTO Net Zero strategy: A climate action pathway to 2030 and beyond, City of Toronto, November 2021
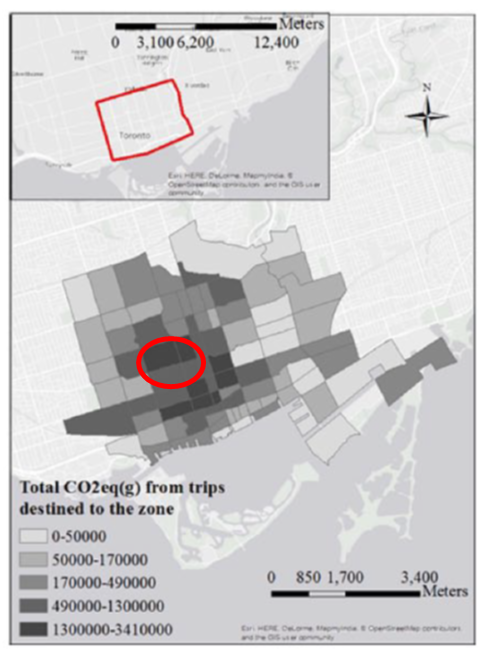
The St George campus and the hospitals (red circled area in left figure below) are responsible for high emissions due to the number of trips they attract and the emission intensity of those trips.
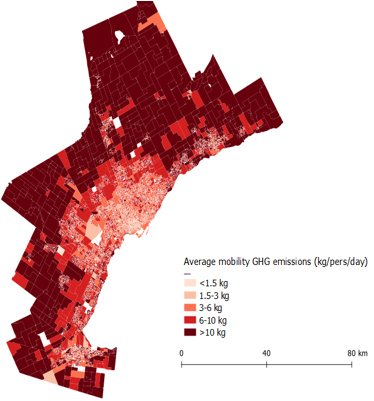
Transport GHG emissions are a manifestation of multiple factors (right figure below):
where a person lives and works
mode of transportation & choices available
vehicle technology
attitudes and perceptions
Total CO2eq from trips destined to the zone
Average mobility GHG emissions (kg/pers/day)
Research methods
Reducing the GHG emissions of the UofT community requires an understanding of the entire set of factors influencing personal choices
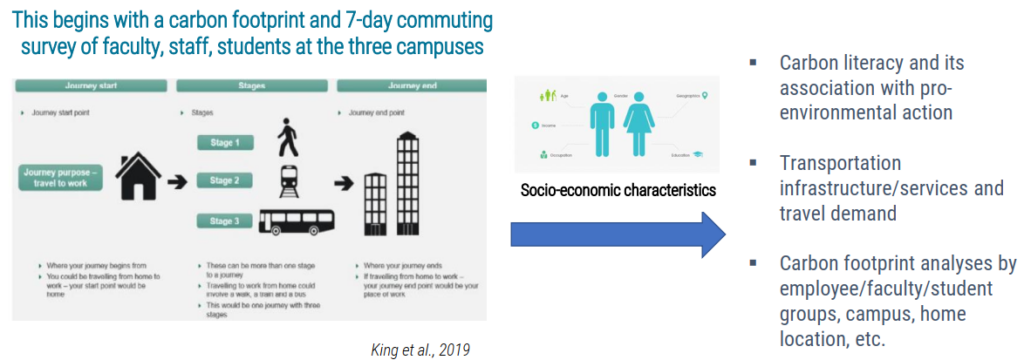
A carbon footprint and 7-day commuting survey of faculty, staff, students at the three campuses
Another element to reduce the transportation GHG emissions is to reveal how changes to social external information will alter travel behavior
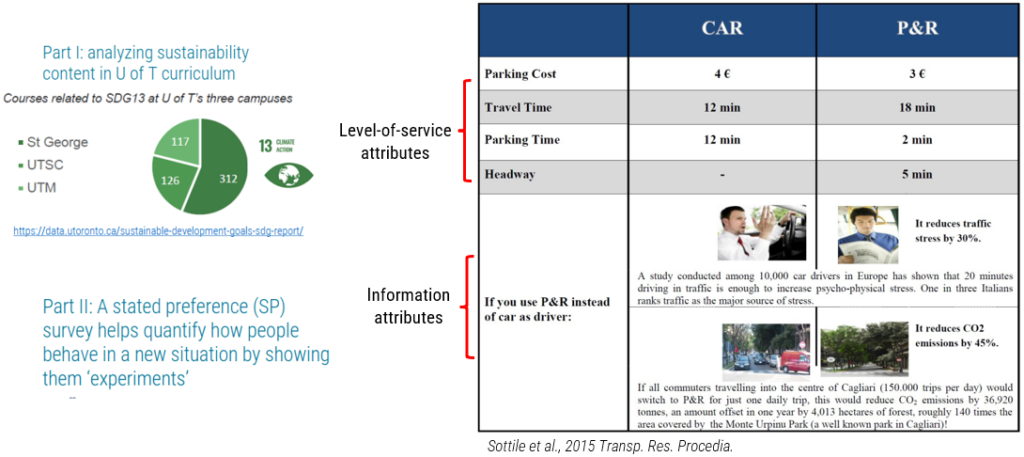
Analyzing sustainability content in UofT curriculum and a stated preference survey to quantify how people behave in a new situation
To implement the outcomes of this research, we propose a set of information tools and real-world interventions
Transportation GHG calculator and real-world interventions