


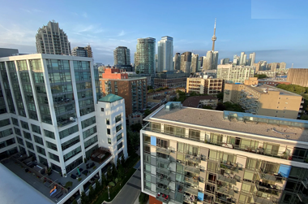

Fixed monitors at rooftop
& ground level throughout community

Indoor/outdoor monitoring
using low-cost sensors

Mobile sampling to map
near-road air pollution

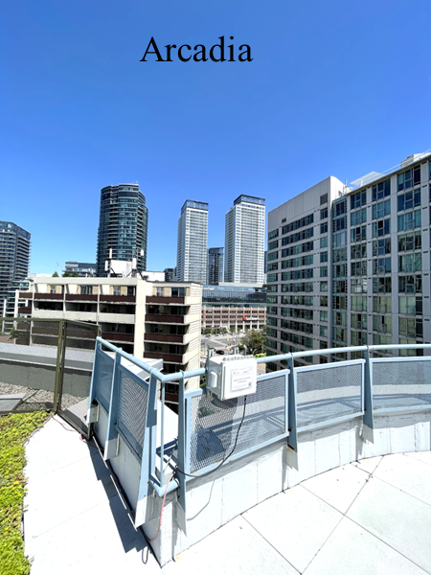
7-story
900m from the airport runway
7-story
800m from the airport runway

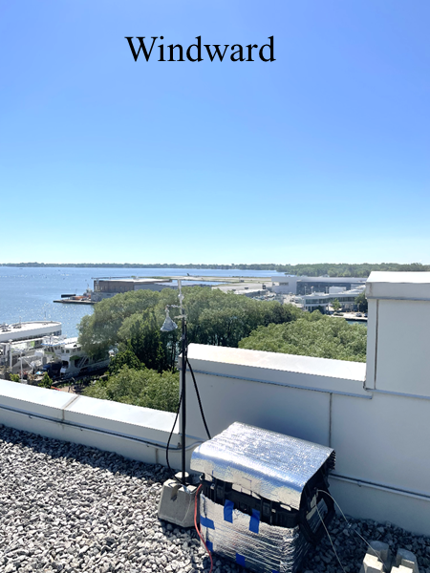
2-story
650m from the airport runway