Research study: Fifteen years of community exposure to heavy-duty emissions: Capturing disparities over space and time
Disparities in exposure to traffic-related air pollution have been widely reported.
This study aims to investigate the impact of various vehicle types on populations of different socioeconomic/ethnic backgrounds.
An extreme gradient boosting approach was employed to spatially distribute light-duty vehicle (LDV) and heavy-duty truckemissions across the city of Toronto from 2006 to 2020.
Associations between emissions and different marginalization indices were examined across the time span.
Key findings
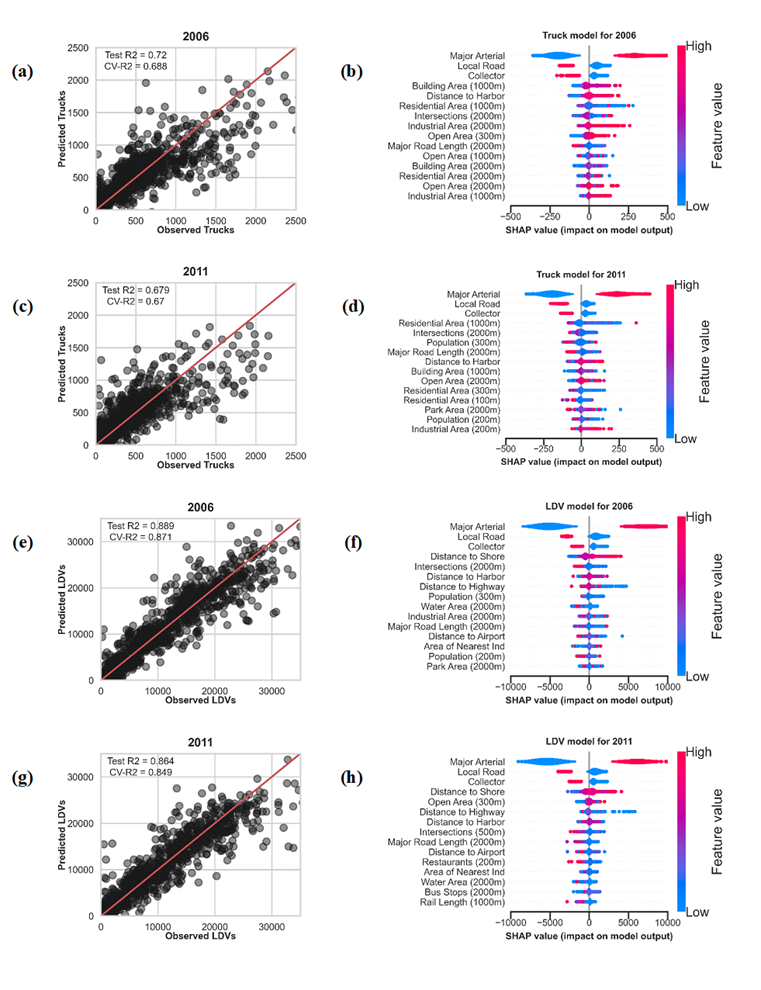
1. Model results (for 2006 and 2011) and the output of the SHAP method which displays the top 15 predictors, ranked by importance, with their influence on truck and LDV volumes.
Scatter plots of predicted and observed vehicles as well as SHAP plots for presenting top important variables
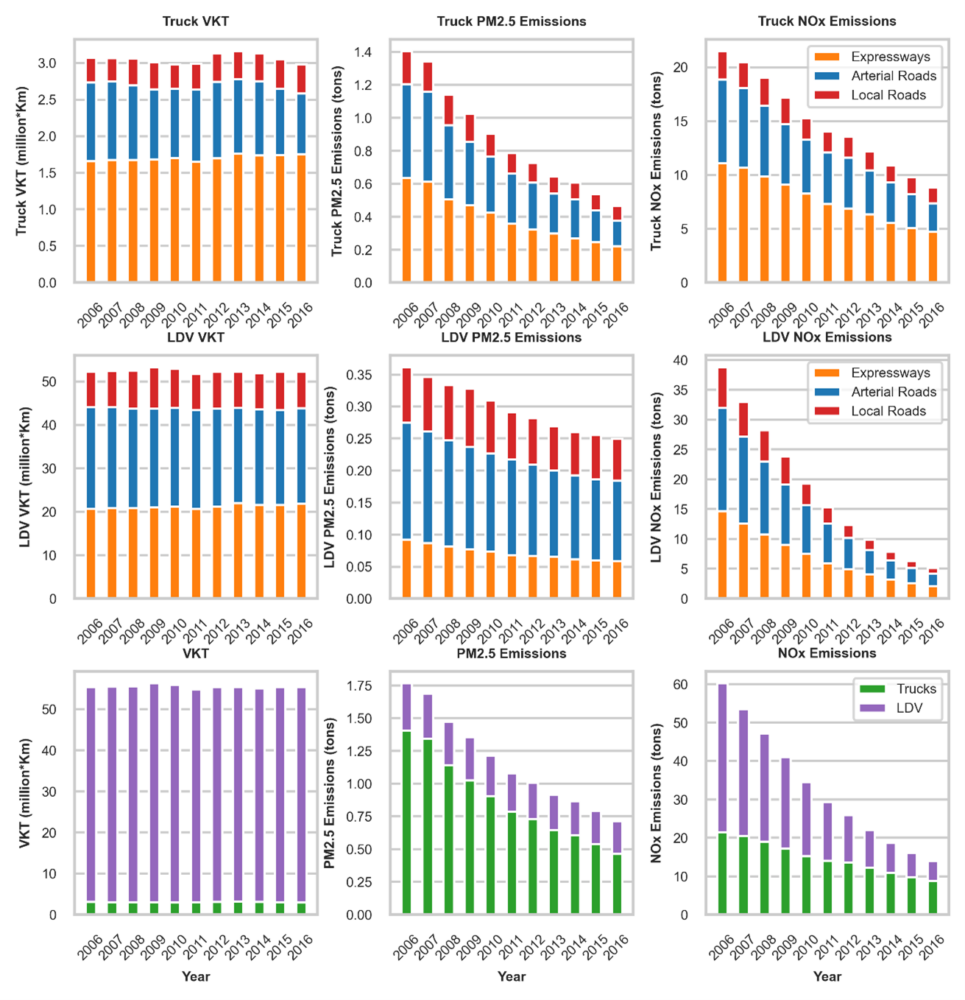
2. Trends in daytime truck and LDV Vehicle Kilometres Travelled (VKT), PM2.5 emissions and NOx emissions from 2006 to 2016 for a single weekday.
Bar plots of trends in daytime truck and LDV VKT, PM2.5 and NOx emissions from 2006 to 2016
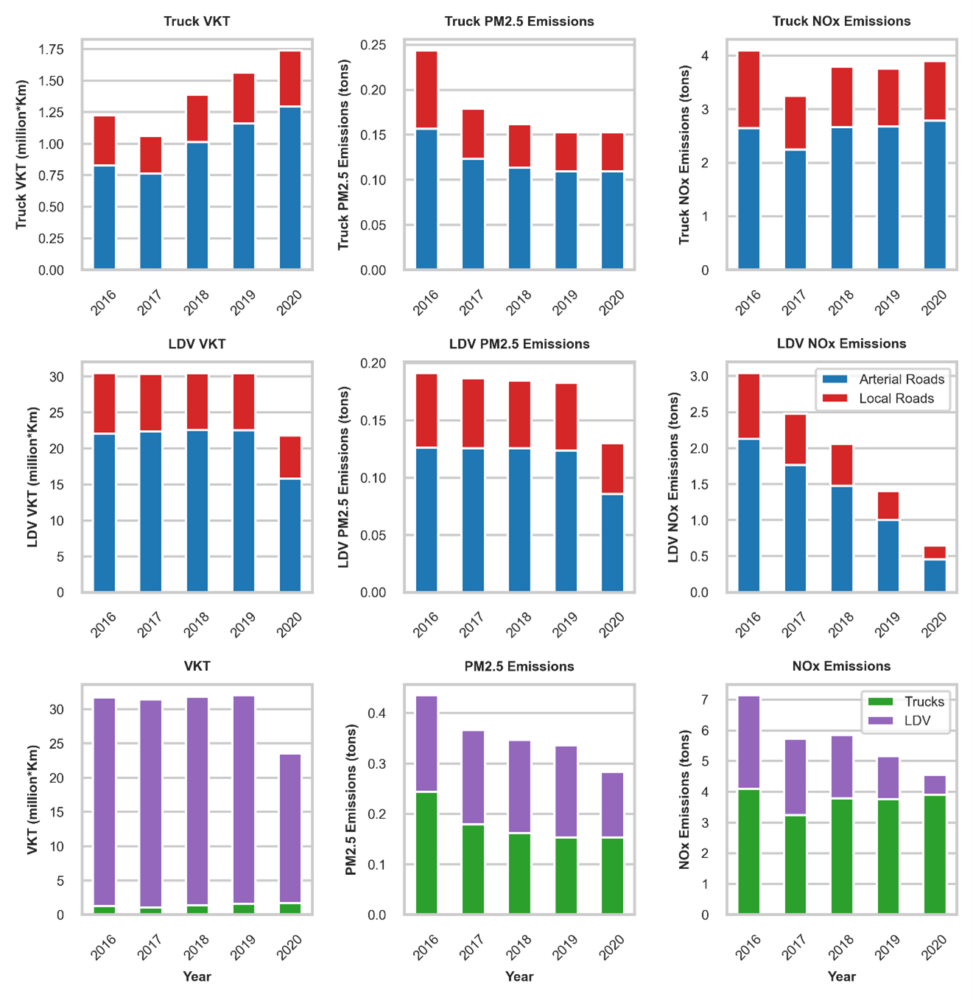
3. Trends in daytime truck and LDV VKT, PM2.5 emissions and NOx emissions from 2016 to 2020 for a single weekday. Note that the year 2020 represents data collected after initial phase of reopening and does not include the lockdown period from March 2020 to June 2020.
Bar plots of trends in daytime truck and LDV VKT, PM2.5 and NOx emissions from 2016 to 2020
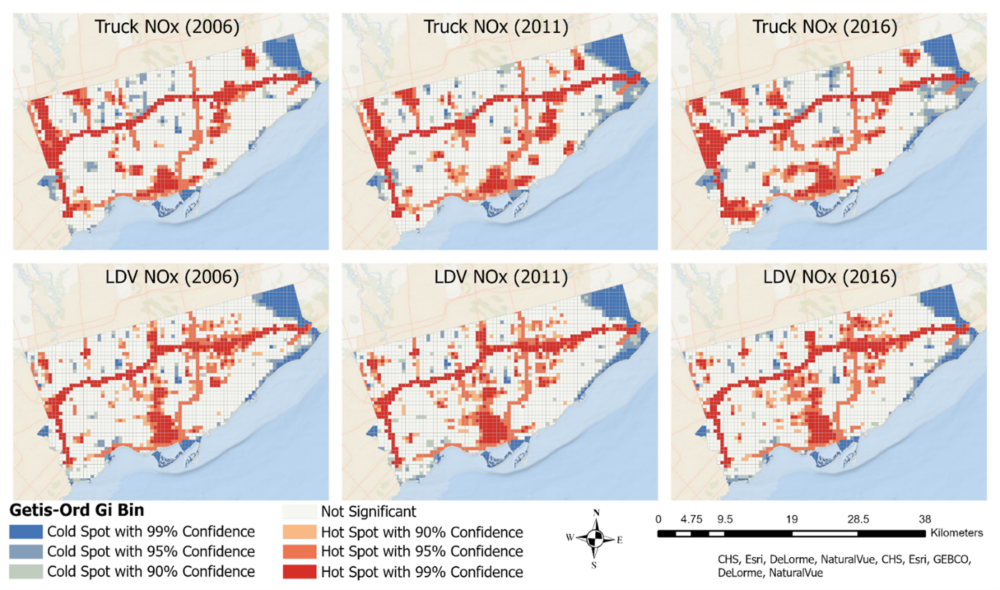
4. Results of hotspot analysis for truck NOx emissions at the top and LDV NOx emissions at the bottom.
Spatial distributions of hotspots for truck NOx emissions and LDV NOx emissions
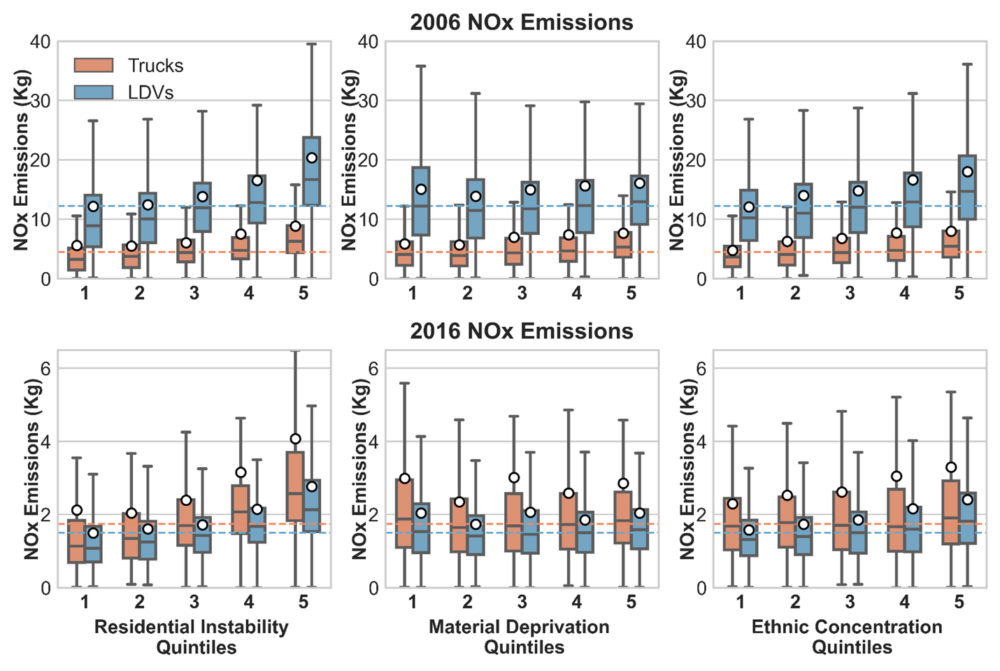
5. NOx emissions divided by quintiles for different marginalization indexes. The white dots indicate the mean emissions, and the dashed lines indicate the median emissions per DA for the entire city from LDVs (in blue) and trucks (in orange).
Boxplots of NOx emissions for different marginalization indexes
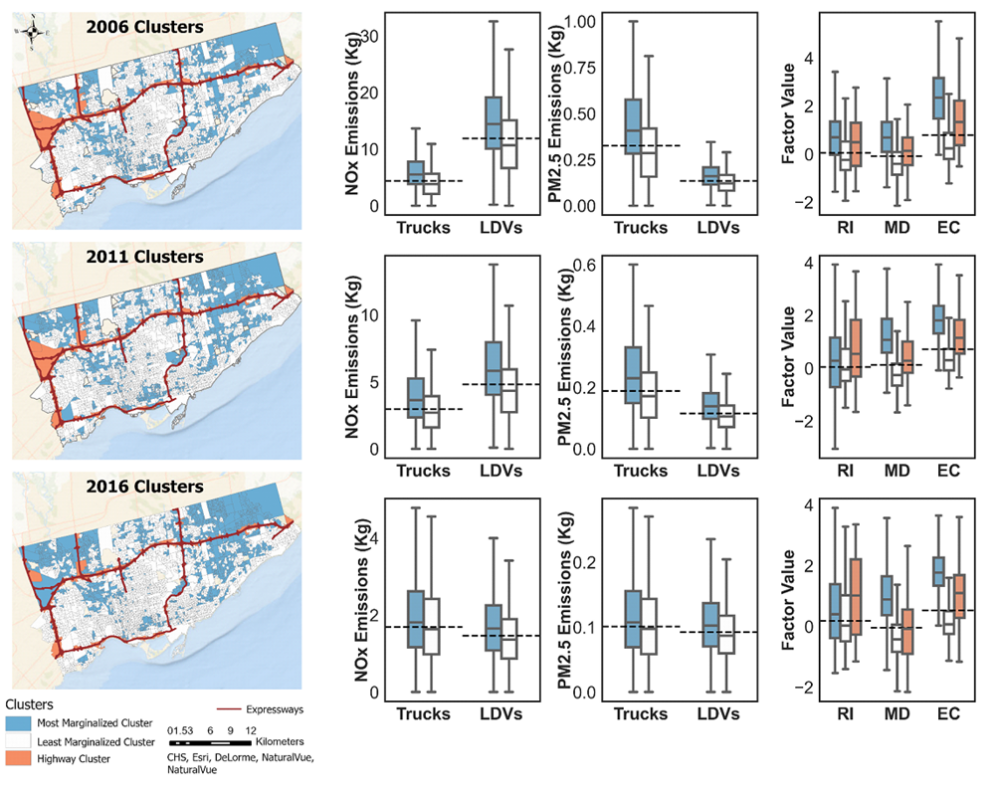
6. Results of K-means clustering algorithms for 2006, 2011 and 2016. Average emissions in the highway clusters were orders of magnitude higher than for the other 2 clusters.
Spatial maps of clustering results and boxplots of NOx emissions generated from trucks and LDVs